Fall Quarter 1999
Electrical Engineering and Computer Science Department
Dr. Christopher C. Taylor
S-331, 277-7339
![]()
www.msoe.edu/~taylor/
Purpose
In this assignment you will create a program that will estimate the
value of  .
.
Assignment
First, consider the figure below:

The figure represents one quarter of a unit circle (a circle with radius=1).
The area under the curve is equal to  /4 since
the area of a unit circle is
  r2 =
r2 =
 12 =
12 =  .
Now, if we were to randomly plot a point in the square above, the
probability that it would be under the curve is equal to the ratio of the
area under the curve to the area of the square (
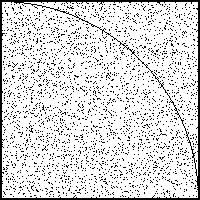
 /4). The figure below contains a number of random points plotted
in the unit square.

By taking the ratio of all of the dots that landed under the curve to the
total number of dots plotted, we can estimate the value of
 . There are 4000 random points in the above figure.
3143 of them lie under the curve, so we estimate
  to be 3.143.
- Write a function that when passed an unsigned integer, n, will
return a vector of 2n random numbers between zero and one.
- Use the rand() function from the cstdlib library to generate random numbers.
- rand() generates random integers uniformly distributed between zero and RAND_MAX. You will need to convert them to doubles between zero and one.
- Write a program that asks the user for the number of random points
he/she wishes to use to estimate
 .
. - The program should then call the above function to generate the correct
number of random numbers and then use those numbers to estimate
 .
. - After each estimate is made, your program should ask the user whether or not he/she wishes to perform another estimate.
Programming consideration: It is always good in program design to consider potential modifications that may be required a some later date. Be sure to keep this in mind when designing your program.
Lab report (due 4:30pm Tuesday, November 2, 1999)
This lab report need not be self-contained. At a minimum, your report should include:
- A brief discussion of what you learned and what problems you encountered.
- Documented source code (you may wish to include this at the end of your report)
- Sample output from your program.
- Any suggestions on how the lab could be improved.
As with any report you submit, correct spelling and grammar are required. In addition, your report should be submitted electronically following the Electronic Submission Guidelines. (You may wish to consult the sample report before submitting your report.) Be sure to keep copies of all your files, in case something gets lost. It may be wise to keep a diskette backup as well.
If you have any questions, consult the instructor.
This page was created by Dr. Christopher C. Taylor copyright 1999.
![[MSOE Homepage]](../graphics/nlogo2.gif)