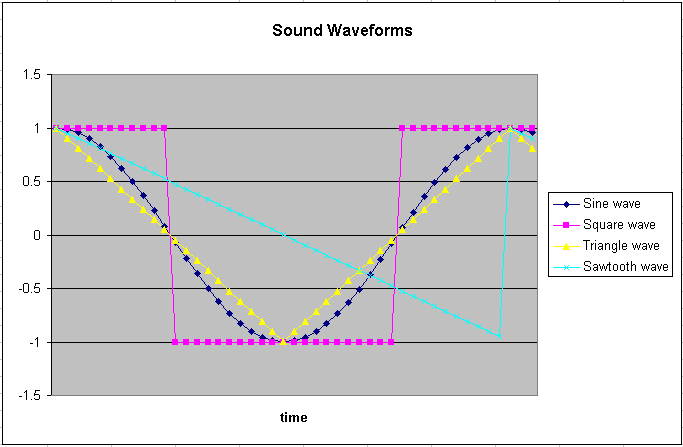

A musical note is represented by a sine wave at a specific frequency. The table below gives the frequencies of different notes.
| Note | Frequency (Hz) |
| A | 220 |
| A# | 233 |
| B | 247 |
| C | 262 |
| C# | 277 |
| D | 294 |
| D# | 311 |
| E | 330 |
| F | 349 |
| F# | 370 |
| G | 392 |
| G# | 415 |
Doubling the frequency gives you the same note one octave higher while halving the frequency gives you the same note one octave lower.
Create a Microsoft Excel spreadsheet that consists of two worksheets. The first worksheet should contain only two columns of numbers. The first column should represent time and the second column should represent the voltage sent to the speakers. The second worksheet should allow the user to change the frequency and sampling rate of the sound produced. It should also contain a graph of the first 200 voltage numbers from the first worksheet. Your instructor will demonstrate how to generate these worksheets in class.
In order to listen to the sound generated by this data you will need to:
Once finished with this you should modify the spreadsheet to:
This exercise was developed by Dr. Chris Taylor.