Overview
Many of you may be familiar with a time wasting "game" proportedly used to help kids learn how to count. The "game" involves drawing lines between dots in order to reveal a picture. In this assignment you will design, implement, and test a program to generate connect the dot games.
Details
Setup Procedure
First, create an IntelliJ project and add the
WinPlotter.jar file (see instructions
for doing this here)
to the project. This file contains the WinPlotter
for drawing the lines/dots. Documentation for the
WinPlotter class may be found here.
General Program Guidelines
Your program must:
- Allow the user to select and load a graphic file
- Indicate the total number of points in the selected file
- Allow the user to enter a desired number of points
- Give the user the option to draw the desired number of dots on a
WinPlottersurface - Give the user the option to draw lines between the desired number of
points on a
WinPlottersurface - Optional: Give the user the option to draw the desired number of
dots and the lines in between the dots
on a
WinPlottersurface
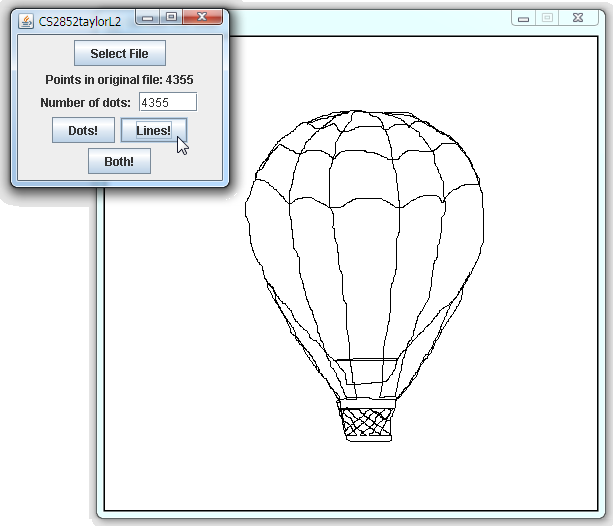
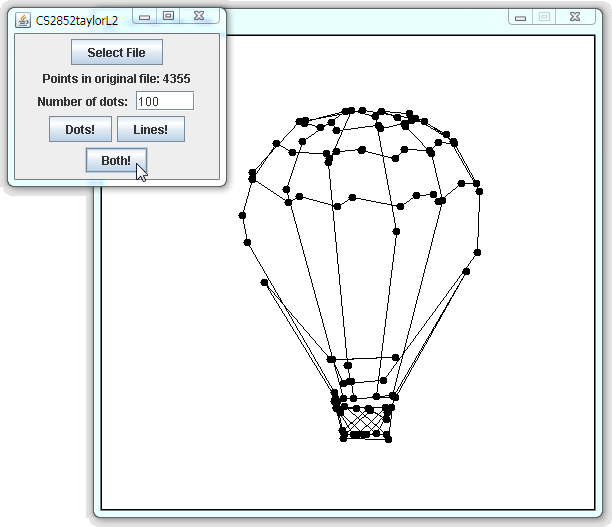
Your program should look something like this:
Graphic File Format
Your program must be able to read graphic files that contain a list of points. The file is formatted such that each point is on a separate line. A point consists of a horizontal and vertical component separated by a comma. Each component is a floating point value between zero and one. For example, square.pnt looks like this:
0.1, 0.1
0.1, 0.9
0.9, 0.9
0.9, 0.1
Here are a few sample .pnt files: circle.pnt, balloon.pnt, dove.pnt, magician.pnt, and skull.pnt.
If you'd like to make your own graphic files, you can use the GraphicFileGenerator. The program begins with a file chooser dialog that can be used to select a background image (which you can then trace). Hit cancel if you'd rather just have a black background. To draw, press and hold the mouse down. When you're done, release the mouse. You'll then need to save the points to a file (use the menu).
How to Find the Most Critical Dots
The following flow chart describes the algorithm for the method that
returns a List containing the most critical
points for finding the numDesired most
critical points.
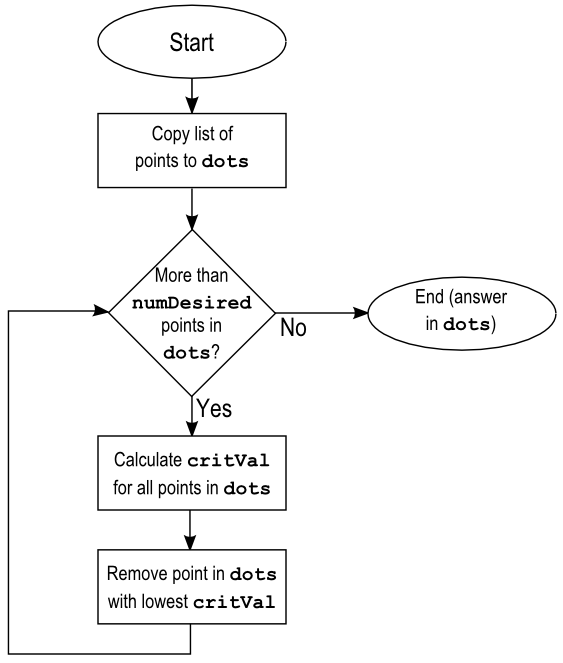
The next section describes how to calculate critVal for each point.
Calculating the Critical Value of a Point
The critical value of a point depends on the relative proximity of it and its immediate neighbors. Consider three points, labeled 1, 2, and 3, on a straight line. If point 2 is removed, the connect the dots version of the line from 1 to 3 will look exactly the same. Therefore, we can conclude that the point is not critical. If point 2 is significantly far from the line connecting points 1 and 3, then error would be introduced if point 2 is eliminated. The following figure illustrates this.
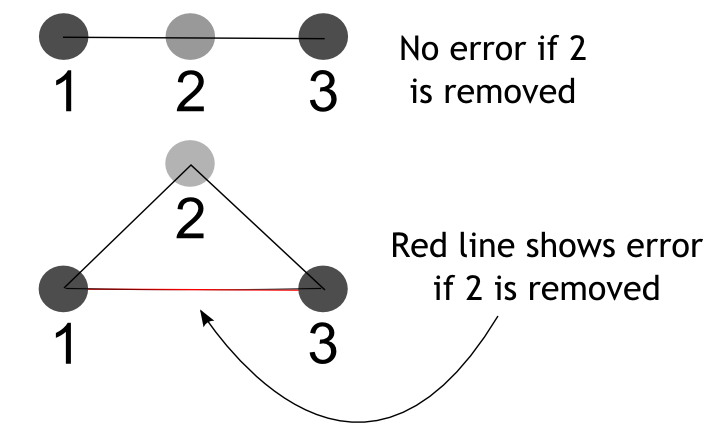
The critical value of point 2 is calculated as the sum of the distances
from point 2 to point 1 and to point 3 minus the distance from point 1 to point
3, i.e., critVal2 = d12
+ d23 - d13 where are
dxx are the distances illustrated
below.
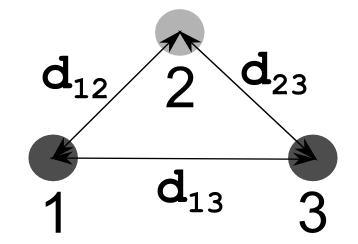
Note that in the case of a straight line between points 1 and 3,
critVal2 = 0.
Your program should assume that the first and the last point are connected so they should be treated as neighbors when calculating their critical values.
Software Design
Be sure to give approriate consideration to the design of your program. What classes will you need? How will objects for the various classes interact with one another? A good design will result in logical separation of functionality (UI in one class), managing the "shape" in another class that keeps a list of points, where the points are likely a custom class that keeps track of the points coordinates and is able to calculate its critical value when it knows its neighbors.
While the design is left somewhat open for you, you are required to have a method with a signature that looks like this:
/**
 * Accepts a list of dots, original, and copies the dots into a list,
 * result, that starts out empty.  The method then uses the technique described
 * in the lab assignment to remove all but the numDesired number of dots.
 * <br />
 * If fewer than numDesired dots are found in original, then a copy of all
 * the dots in original is returned.
 * @param original The list of dots read in from the data file
 * @param result An empty list that will contain the numDesired most critical
 *        dots from the original list
 * @param numDesired The number of dots desired in the resulting list, must be
 *        at least 2
 */
public static void getDesiredDots(List<Dot> original, List<Dot> result, int numDesired);
Acknowledgements
This assignment, written by Dr. Chris Taylor, is motivated by the seventh programming project in chapter 2 of our textbook which is based on the paper: L. J. Latecki and R. Lakamper, "Convexity Rule for Shape Decomposition Based on Discrete Contour Evolution," Computer Vision and Image Understanding (CVIU) 73(1999), pp. 441-454.
Lab Deliverables
Your submission must include:
- A brief description of your design (what does each class do, how do instances of the classes interact with each other, etc...)
- Your fully documented source files
Dr. Taylor's class: See below
Dr. Yoder's submission instructions